![n[0] = 1/(2*Pi*r[0]^2)](animated-text2.gif) ,
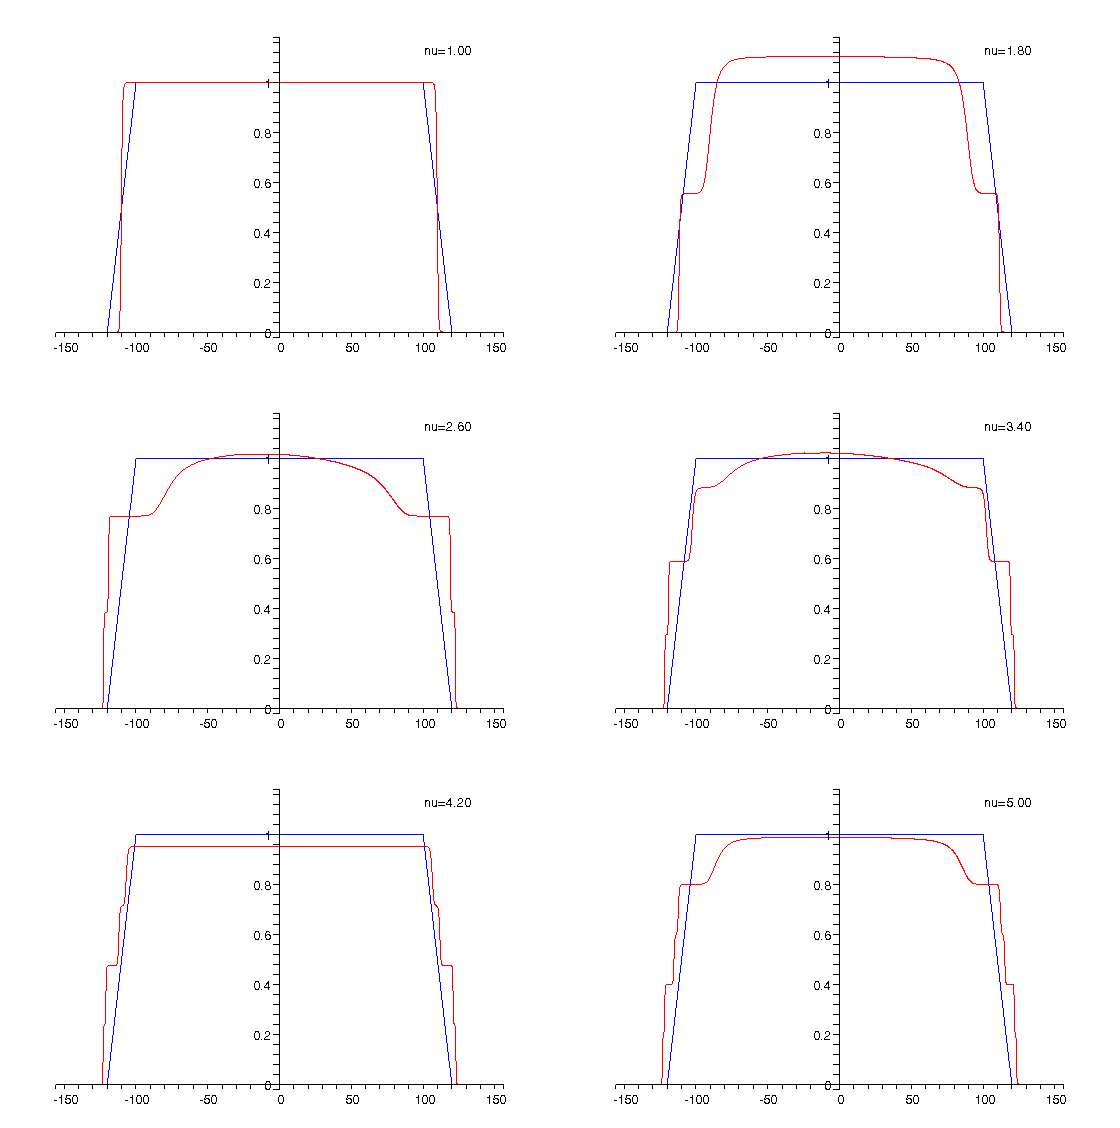
is plotted in red color in Animation 1 as a function of the radial coordinate
,
is plotted in red color in Animation 1 as a function of the radial coordinate
In this page you can find animations of the electron charge
and current densities for a two-dimensional electron gas in a quantum Hall
ring
of major radius R and width 2a. For a more
detailed explanation see cond-mat/0404681.
The electron charge density ![]() ,
measured in units of
,
measured in units of ![n[0] = 1/(2*Pi*r[0]^2)](animated-text2.gif) ,
is plotted in red color in Animation 1 as a function of the radial coordinate
,
is plotted in red color in Animation 1 as a function of the radial coordinate ![]() between -150 and 150 (in units of
between -150 and 150 (in units of ![]() )
measured from the major radius
)
measured from the major radius ![]() of the quantum Hall ring, where
of the quantum Hall ring, where ![]() is the avearge interparticle spacing. The constant positive background
charge density has a trapezoid shape as plotted with blue color in the
same units on Animations 1, 2 and 3. All animations have been produced
from data computed numerically by Hartree method at temperature
is the avearge interparticle spacing. The constant positive background
charge density has a trapezoid shape as plotted with blue color in the
same units on Animations 1, 2 and 3. All animations have been produced
from data computed numerically by Hartree method at temperature
![]() =
0.005 in units of
=
0.005 in units of ![]() where
where ![]() is the dielectric constant.
is the dielectric constant.
 |
Animation 1: The electron charge
density for The animation shows how the charge density changes when the filling factor |
The charge density shown in Animation 1 is computed as
the sum of the partial densities corresponding to spin up and down. Because
the magnetic field B (whose magnitude is inversly proportional to ![]() )
is parallel to the z axis the majority of the electrons would have
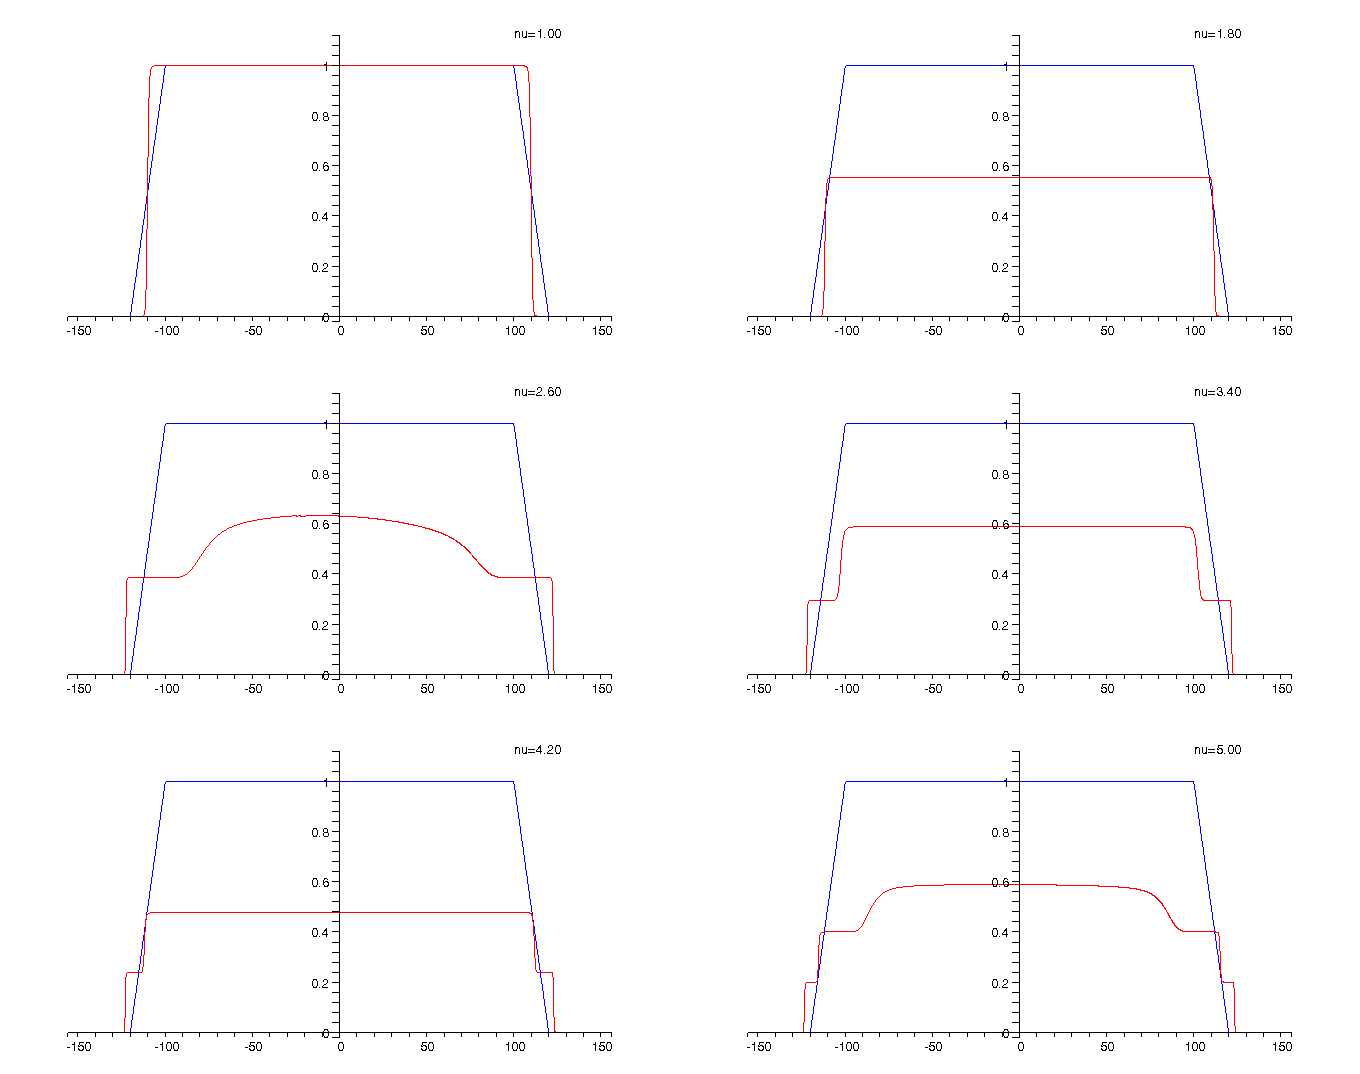
spin up. The evolution of the spin-up density with the filling factor
)
is parallel to the z axis the majority of the electrons would have
spin up. The evolution of the spin-up density with the filling factor ![]() is
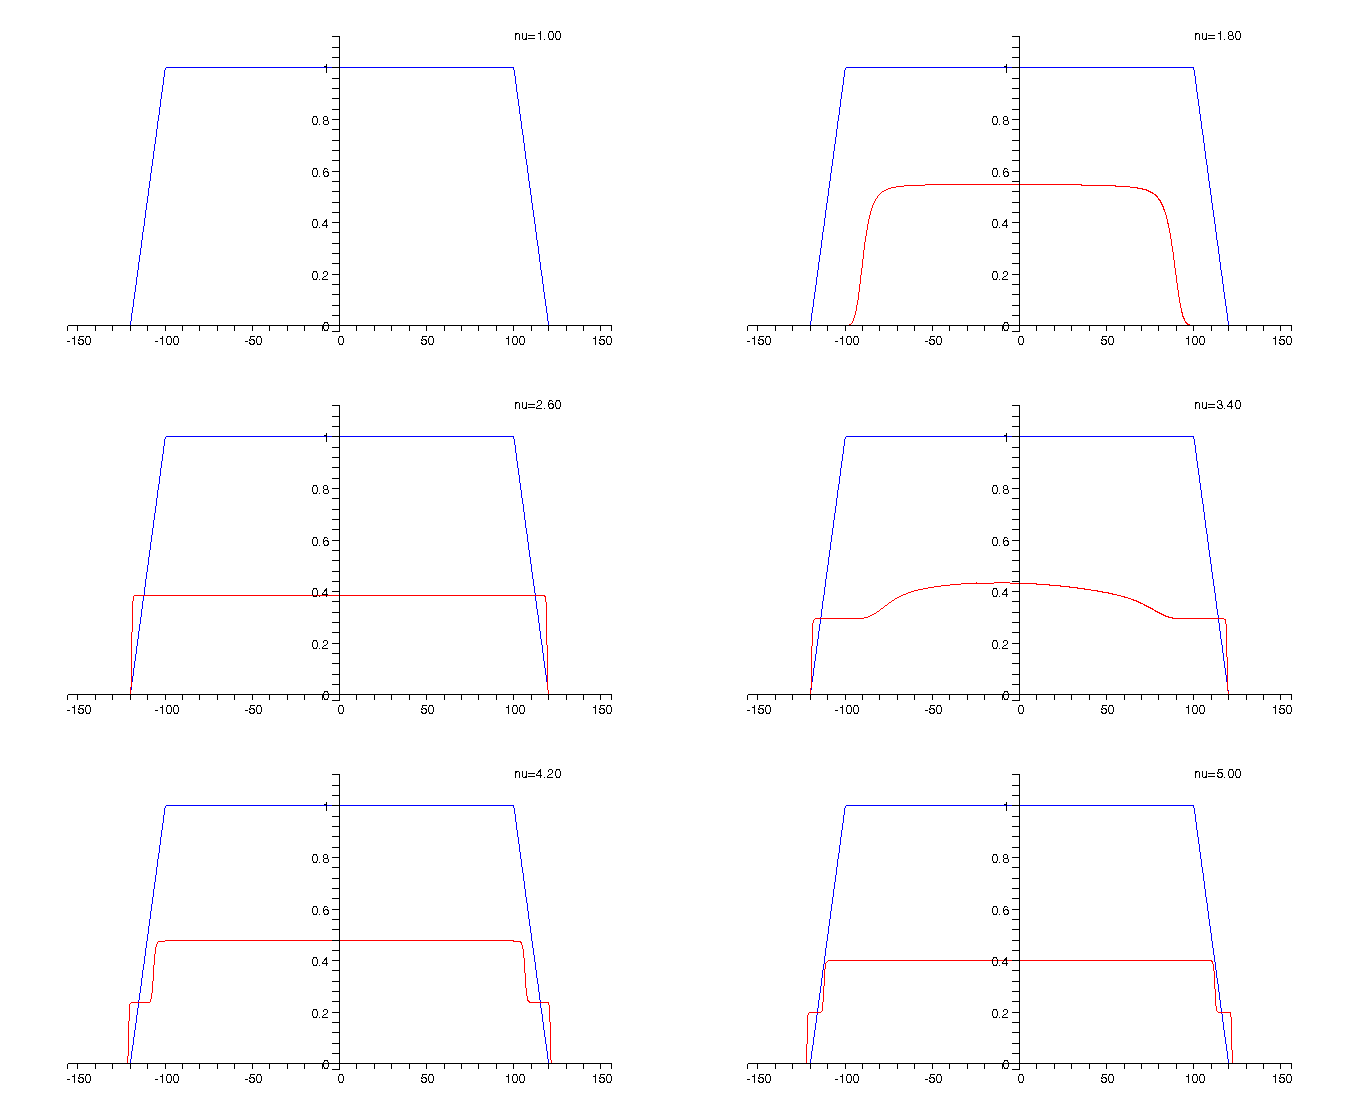
shown in Animation 2, while that of the spin-down electrons is displayed
on Animation 3.
is
shown in Animation 2, while that of the spin-down electrons is displayed
on Animation 3.
 |
Animation 2: The charge density
for spin-up electrons
The spin-up density is shown in red and is compared to the trapezoid-shaped positive background charge density which is plotted in blue. |
 |
Animation 3: The charge density for spin-down electrons
The spin-down density is shown in red and is compared again to the trapezoid-shaped positive background charge density which is plotted in blue. |
Animation 4: The current density for ![]()
The current density ![]() ,
measured in units of
,
measured in units of ![j[0] = e*h/(4*Pi^2*m*r[0]^3)](animated-text13.gif) , which has both edge and bulk components that are computed as certain
radial derivatives of the charge density and Hartree potential, is plotted
bellow as a function of the radial coordinate
, which has both edge and bulk components that are computed as certain
radial derivatives of the charge density and Hartree potential, is plotted
bellow as a function of the radial coordinate ![]() .The red curve shows how the current density evolves as the filling factor
.The red curve shows how the current density evolves as the filling factor ![]() is
changed from 1 to 5 . The blue colored curve shows for comparison the current
density at
is
changed from 1 to 5 . The blue colored curve shows for comparison the current
density at ![]() and
can be used to mark the two edges of the two-dimensional quantum Hall ring.
and
can be used to mark the two edges of the two-dimensional quantum Hall ring.

As can be seen from the above animations alternating compressible
and incompressible strips are formed at the inner and outer edges of the
ring when the filling factor (respectively the magnetic field) is varied.
The positions of the compressible strips are where the electron charge
density changes rapidly, while the incompressible ones correspond to the
regions between the compressible strips where the charge density is approximately
constant. The peaks in the current density correspond to the compressible
strips while in the incompressible channels the current is much smaller
in amplitude and opposite in direction as compared to the peaks and the
number of peaks corresponds to the number of (completely or partially)
occupied Landau levels.